Introduction | Main results | Political instability | Corruption| Informal sector | Access to finance | Workforce skills | Electricity | Conclusion
Improving the business environment is important for unleashing the full productive capacity of the private sector. This report summarises feedback from the managers of firms in four countries in the southern and eastern Mediterranean (SEMED) regarding the main challenges in the business environment that they experience on a daily basis. Across the board, managers reported that they were most constrained by: (i) political instability, (ii) corruption, and (iii) competitors’ practices in the informal sector.
In the wake of the global financial crisis and the Arab uprising, governments in the SEMED countries are searching for ways to resuscitate economic growth. One course of action is to create a more conducive business environment, which can boost growth by establishing more competitive and fair conditions for all businesses.
This report summarises the key results of the first Middle East and North Africa Enterprise Surveys (MENA ES), which were conducted by the European Bank for Reconstruction and Development (the EBRD), the World Bank Group and the European Investment Bank in four SEMED countries between 2013 and 2015.i Senior managers were interviewed at more than 4,400 randomly selected firms with at least five employees. Chart 1 shows the geographical coverage of the MENA ES in the SEMED region.
Managers were asked for their views on topics such as infrastructure; competition; sales and supplies; labour; innovation; land and permits; crime, theft and disorder; access to finance and relations between business and government. They were also asked about the management practices in their firms.
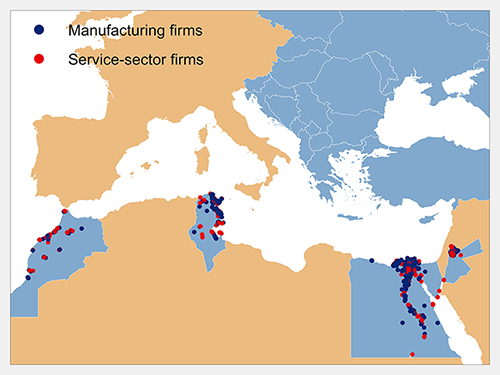
Source: MENA ES. Note: MENA ES was conducted in 2013-15. Each dot indicates a locality with one or more firms and not each individual firm.
In SEMED overall, the top three obstacles identified by firms were (i) political instability; (ii) corruption; and (iii) competitors’ practices in the informal sector. Chart 2 shows the top three obstacles in each country according to MENA ES. In the rest of the EBRD region, they were somewhat different: competitors’ practices in the informal sector were at the top, followed by limited access to credit and expensive or unreliable electricity supply.
It is important to note that the analysis is based on constraints as perceived by each firm – that is, their answers may reflect differences in firms’ sensitivity to constraints on their business, rather than actual differences in those constraints.ii As such, it can only inform policy priorities within countries and cannot be used to rank the quality of the business environment across countries.
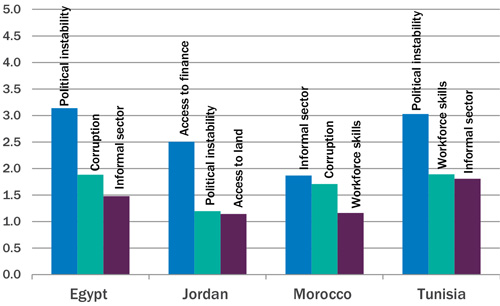
Source: MENA ES and author’s calculations.
Note: MENA ES was conducted in 2013-15. Estimated for a hypothetical “average” firm. Higher values correspond to a weaker business environment.
Political instability
Political instability was among the top five concerns in all of the SEMED countries, and was the biggest concern in Egypt and Tunisia. The reasons behind this differ somewhat. Tunisia and Egypt both experienced uprisings in late 2010 or early 2011, which were followed by political transitions. All SEMED countries face security challenges as a result of spill-overs of regional turmoil and external shocks, as well as the spread of extremism in the region.
Corruption
Firms in Egypt and Morocco considered corruption to be the second biggest obstacle, with firms in Jordan and Tunisia putting it in fourth place. There is evidence that corruption limits job creation by younger firms,iii with negative consequences for the economies with higher numbers of unemployed young people.
Informal sector
Firms in three out of four SEMED countries considered competitors’ practices in the informal sector to be among the top three obstacles. Only in Jordan were they in ninth place. The informal sector has generally developed over the years as a response to increasingly complex bureaucratic systems coupled with unclear rules of enforcement and insufficient legal protection.
Not all types of firm complain about the same aspects of the business environment. The retail sector, for example, is typically more exposed to the shadow economy than the manufacturing sector, especially when it comes to smaller firms. Moreover, young firms play a particularly important role in creating jobs, so it is important to understand which types of obstacle they consider to be the most problematic.
In SEMED, the so-called “young” firms – those that have been in operation less than five years – were most constrained by access to land, corruption and electricity issues, rather than political instability and competitors’ practices in the informal sector, although there were of course differences across countries. Access to land was among the top three obstacles identified by young firms in Jordan, Morocco and Tunisia. In Jordan, young firms also complained about tax administration, while in Morocco, they were concerned about transport issues. Firms in Morocco and Tunisia that have been around for at least five years, on the other hand, named problems related to an inadequately educated workforce as a top three obstacle.
Large firms – those with at least 100 employees – were most concerned about corruption, political instability and limited access to finance. An inadequately educated workforce was among the top five obstacles for large firms in Jordan, Morocco and Tunisia.
Competitors’ practices in the informal sector and an inadequately educated workforce were the top two constraints for retail-sector firms in the SEMED countries, while manufacturing and other services firms complained most about political instability and corruption.
It is not surprising that political instability emerged as the top business environment obstacle in this region.
Tunisia experienced the first uprising in the MENA region known as the “Jasmine Revolution”, preceded by high unemployment, food inflation, corruption, lack of freedom of speech and other forms of political freedom, and poor living conditions. This was followed by an uprising in Egypt, with grievances focusing on similar issues as in Tunisia and other Arab countries. There were also protests in Jordan and Morocco, which resulted in governmental changes, but unlike in Egypt and Tunisia, the governments were not overthrown.
Moreover, all SEMED countries face security challenges due to the spread of extremism and as a result of spill-overs of regional turmoil and external shocks. The Syrian conflict that has been unfolding since 2011 and the tense security situation in Lebanon have posed a significant challenge for Jordan with an influx of over 800,000 Syrian refugees, adding to other refugee communities that Jordan has hosted from previous regional conflicts. Tunisia, where the political transition has been the most peaceful, is affected by spill-overs from the instability in neighbouring Libya.
Besides disrupting firms’ current operations, uprisings, security challenges and uncertainty can influence investment plans, result in lower job creation, expand the shadow economy and undermine broader private-sector development, thereby stifling economic growth.
Corruption was one of the factors that led to the Arab uprisings, so it is not surprising that firms in the SEMED countries identified it as the second most severe obstacle. There is scope for corruption in any interaction that requires contact between firms and service providers or government officials. Moreover, all of the SEMED countries had a system of privileges for firms with political connections, characterised by policies that limit free entry in the domestic market, exclude certain firms from government programmes, increase the regulatory burden and uncertainty for firms without connections, insulate certain firms and sectors from foreign competition, and create incentives that discourage domestic firms from competing in international markets.
The share of firms reporting that informal payments or gifts were expected or requested in interactions with government officials was higher in SEMED than the rest of the EBRD regions in several areas: when applying to be connected to electricity (20 per cent, compared with 12.1 per cent and sitting above all the other EBRD regions except Central Asia), when applying for an import licence (8.7 per cent, compared with 6.9 per cent) and when applying for an operating licence (19.9 per cent, compared with 9.4 per cent). On the other hand, the shares of firms reporting that informal payments were expected or requested by tax officials or when applying for a construction-related permit were below the averages in the rest of the EBRD region (6.2 per cent and 13.3 per cent, respectively, compared with 8.6 per cent and 17.6 per cent, respectively) (Chart 3).
In Jordan, no firms reported that informal gifts or payments had been expected or requested in return for being connected to the electricity grid, while in Egypt, more than 40 per cent did. This was again higher than in any other EBRD region and second only to the Kyrgyz Republic, where half of all firms reported that informal gifts or payments had been expected or requested in return for being connected. In Egypt, more than 60 per cent of firms reported that an informal gift or payment was expected or requested in connection to an application for an operating licence, higher than in any other country in the EBRD region.
Chart 3. Informal payments expected or requested
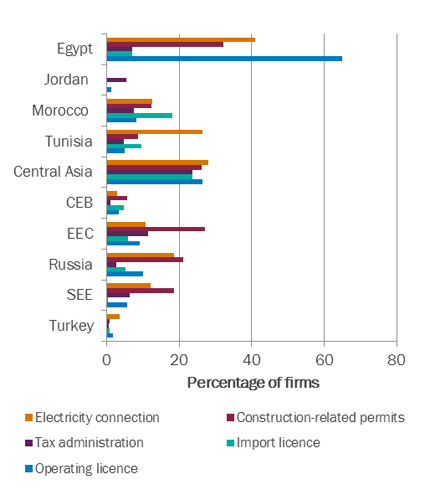
Source: MENA ES, BEEPS V and author’s calculations.
Note: MENA ES was conducted in 2013-15. BEEPS V was conducted in 2013-14 (2011-12 in Russia).
CEB – central Europe and the Baltic states.
EEC – eastern Europe and the Caucasus.
SEE- south-eastern Europe.
SEMED and the rest of the EBRD region were similar in terms of the size of the informal payments the firms reported making to public officials to “get things done” with regard to customs, taxes, licences, regulations, services and the like: in both regions, firms reported that they paid out slightly less than 1 per cent of their annual revenue for this purpose (see Chart 4). Tunisia and Jordan were outliers at the opposite ends of the spectrum: in Jordan, firms reported paying only 0.1 per cent of their annual revenue “to get things done” and virtually no firms reported that informal gifts or payments were expected or requested in interactions with government officials, while in Tunisia, they reported paying out almost 2.7 per cent of their annual revenue for the same purpose.
Jordan was the first Arab country to ratify the UN Convention against Corruption. The Jordanian Anti-Corruption Commission was formed in 2006 and an Access to Information law adopted in 2007 and followed by the Ombudsman law in 2008. The Arab Convention against Corruption came into force in 2013. The relatively low share of firms reporting that informal gifts or payments were expected or requested in several areas might be due to this.
Chart 4. Informal payments to “get things done”
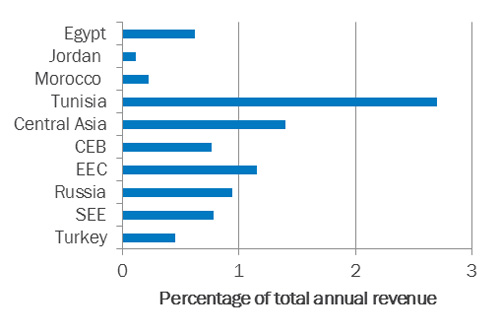
Source: MENA ES, BEEPS V and author’s calculations.
Note: MENA ES was conducted in 2013-15. BEEPS V was conducted in 2013-14 (2011-12 in Russia).
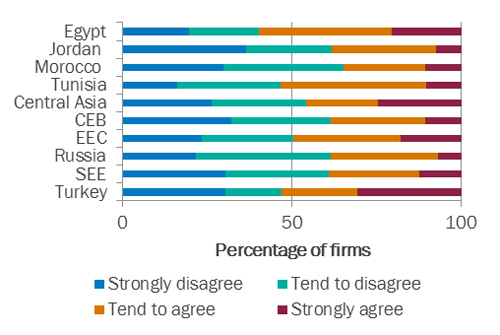
The share of firms that tended to agree or strongly agreed that the court system is fair, impartial and uncorrupted was comparable to that in the rest of the EBRD region: 46.6 per cent versus 42.7 per cent (Chart 5). However, the perception of the court system as being quick or able to enforce its decisions was less favourable.
Chart 5. Perceptions of the court system
Source: MENA ES, BEEPS V and author’s calculations.
Note: MENA ES was conducted in 2013-15. BEEPS V was conducted in 2013-14 (2011-12 in Russia).
Source: MENA ES, BEEPS V and author’s calculations.
Note: MENA ES was conducted in 2013-15. BEEPS V was conducted in 2013-14 (2011-12 in Russia).
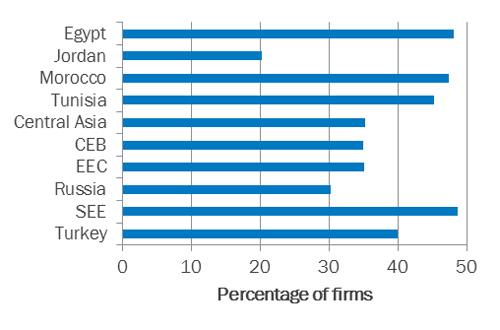
Competitors’ practices in the informal sector were the third most severe obstacle reported by firms in the SEMED region. Slightly more than 40 per cent of all firms mentioned that they faced competition from unregistered firms or other informal-sector activities, with that percentage ranging from 20.2 per cent in Jordan to over 45 per cent in the other three countries (see Chart 6). It was higher than the average in all other EBRD regions, with the exception of south-eastern Europe (SEE).
Chart 6. Competition from the informal sector
Source: MENA ES, BEEPS V and author’s calculations.
Note: MENA ES was conducted in 2013-15. BEEPS V was conducted in 2013-14 (2011-12 in Russia).
The informal sector in the SEMED countries has generally developed over the years as a response to an increasingly complex bureaucratic system coupled with unclear rules of enforcement and insufficient legal protection. Moreover, SEMED countries are characterised by burdensome laws, red tape, and high costs of licensing and registration, which discourage SMEs in particular from formally registering. The World Bank’s Doing Business survey shows that despite some improvements in recent years, starting a business formally requires more procedures and is almost twice as costly in terms of percentage of income per capita as in the rest of the EBRD region.
The shadow economy, however, is more than just unregistered firms. In addition, registered firms often under-report their income, hide employees or fail to declare wages (termed “envelope wages”) to avoid taxes or the need for documentation. Such activities are widespread in businesses that deal largely in cash, such as small shops, bars and taxi companies, as well as firms in the construction, agriculture and household services sectors.
The shadow economy can make entrepreneurship less profitable, hamper investment (by restricting access to credit), undermine broader private-sector development and reduce social protection, thereby stifling economic growth and prosperity. On the other hand, the shadow economy can also provide an outlet for economic activity (mainly in the form of small and medium-sized firms) that is unable to flourish in the face of excessive barriers to enterprise in the formal sector.
Access to finance was also regarded as a major constraint. It was the top constraint in Jordan, and among the top six constraints in the other three countries. The indicators available in the enterprise survey indicate that firms in most SEMED countries, and in particular SMEs, experienced more problems when trying to access finance than their counterparts in most of the other EBRD countries. Many SMEs were discouraged from applying for a loan because of the terms on offer.
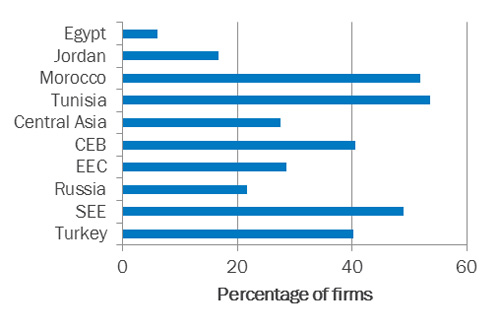
Chart 7 shows the percentage of firms that reported having a loan or a line of credit; it ranged from 6.1 per cent in Egypt to more than half in Morocco and Tunisia. Moreover, only 12.7 per cent of Egyptian firms had an overdraft agreement, compared with around 70 per cent in Morocco and Tunisia. Large and old firms were more likely to have a loan or a line of credit. The differences were particularly stark in Egypt, where 18.1 per cent of large firms and 7.7 per cent of old firms had a loan or a line of credit, compared with just 5.3 per cent of SMEs and 0.6 per cent of young firms.
Chart 7. Firms with a loan or a line of credit
Source: MENA ES, BEEPS V and author’s calculations.
Note: MENA ES was conducted in 2013-15. BEEPS V was conducted in 2013-14 (2011-12 in Russia).
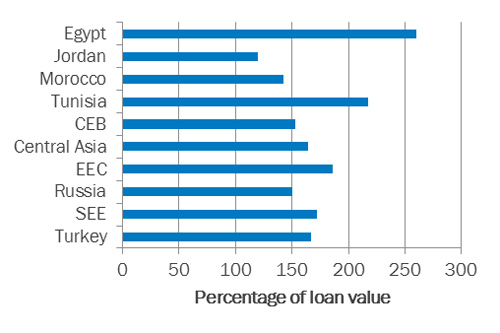
Chart 8 shows that the median collateral required for financing as a percentage of loan value was higher in SEMED than the rest of the EBRD region. It was particularly high in Egypt and Tunisia, where it was above the medians for the other EBRD regions and much higher for SMEs than for large firms. This has made it more difficult for SMEs in particular to access bank credit.
Chart 8. Borrowing firms: median collateral required
Source: MENA ES, BEEPS V and author’s calculations.
Note: MENA ES was conducted in 2013-15. BEEPS V was conducted in 2013-14 (2011-12 in Russia).
The percentage of SEMED firms that had applied for a loan, 21.6 per cent, was slightly below the average of 24.7 per cent for the rest of the EBRD region. However, there were large differences across SEMED countries: in Egypt, only 4.7 per cent of firms had applied for a loan, compared with more than 40 per cent in Tunisia.
Due to the political situation and uncertainty, many firms in Egypt may have revised their investment plans downwards or abandoned them altogether, so they no longer have any need for a bank loan. Indeed, 73 per cent of firms that did not apply for a loan said that they did not need it. In Tunisia, on the other hand, where the political situation is somewhat more stable, firms may be more willing to invest.
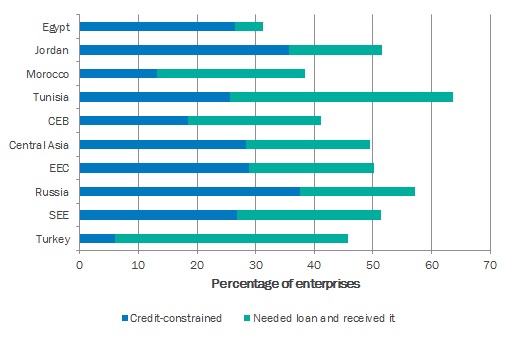
A clear and unambiguous measure of whether firms are credit-constrained can be created by combining firms’ answers to various MENA ES questions. Credit-constrained firms are defined here as those that need credit but have either decided not to apply for a loan or were rejected when they applied.
In SEMED, 46.2 per cent of firms reported that they needed a loan, ranging from less than a third in Egypt to almost two-thirds in Tunisia. This was comparable with the rest of the EBRD region, where almost half of the firms also reported that they needed a loan. However, the share of credit-constrained firms was considerably higher in SEMED: a total of 57.2 per cent of firms turned out to be credit-constrained compared with 51.3 per cent in the rest of the EBRD region. Taken together, this indicates that limited access to finance in SEMED countries was more of a supply-side phenomenon than in the rest of the EBRD region.
There was, however, substantial variation across countries (see Chart 9) as well as type of firm. The percentage of credit-constrained firms ranged from 34.2 per cent in Morocco to more than 85 per cent in Egypt. While this was by far the highest share among all the countries covered in either BEEPS or MENA ES, access to finance was identified as only the sixth most severe obstacle facing Egyptian firms, indicating that they were even more concerned about other aspects of the business environment, such as political instability; corruption; competitors’ practices in the informal sector; electricity issues; and crime, theft and disorder.
Chart 9. Credit-constrained firms
Source: MENA ES, BEEPS V and author’s calculations.
Note: MENA ES was conducted in 2013-15. BEEPS V was conducted in 2013-14 (2011-12 in Russia).
In contrast to the rest of the EBRD region, the share of SMEs and young firms that reported needing a loan was higher in SEMED countries. The differences were particularly large in Egypt, where almost a third of SMEs and 40.2 per cent of young firms needed a loan, compared with 18 per cent of large firms and 29 per cent of old firms, respectively. The exception was Morocco, where more than half of large firms reported needing a loan, compared with 36.2 per cent of SMEs.
However, the share of credit-constrained SMEs was higher than the share of credit-constrained large firms in all SEMED countries. While this is also true elsewhere in the EBRD region, the gap is larger in SEMED: in both SEMED and the rest of the EBRD region, about 30 per cent of large firms were credit-constrained, but in SEMED, the share of credit-constrained SMEs reached almost 60 per cent, compared with just over half in the rest of the EBRD region. In Jordan, more than 70 per cent of SMEs were credit-constrained, compared with 19.7 per cent of large firms. In Egypt, the numbers were 85.9 and 62.4 per cent, respectively. Most firms were discouraged from applying for a loan because of the terms on offer. In both Egypt and Jordan, banks are very liquid, but in general they are not interested in lending to SMEs, which are considered to be riskier clients than large firms.
Limited access to credit may not only constrain firm growth in the short term, but may also have longer-term negative effects. The results for the rest of the EBRD region show that where banks ease credit constraints, firms tend to innovate more by introducing products and processes that are new to their local and national markets.
An inadequately educated workforce was among the top three obstacles in Morocco and Tunisia, and the fifth most severe obstacle in SEMED as a whole. Workforce skills were also among the top obstacles in several countries in the rest of the EBRD region, but the reasons behind the ranking were somewhat different: in SEMED, it is primarily due to the quality of education and skills mismatch, while emigration is an issue in many countries in the rest of the EBRD region.
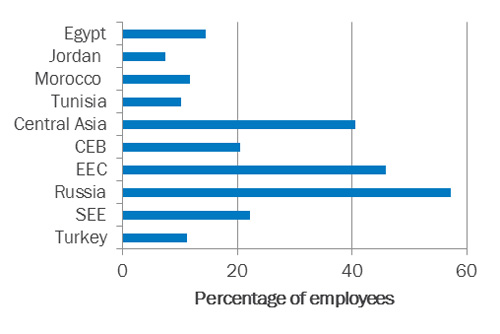
Chart 10 shows that the percentage of employees with a university degree in SEMED countries was below that in other EBRD regions, with the exception of Turkey.
Chart 10. Employees with a university degree
Source: MENA ES, BEEPS V and author’s calculations.
Note: MENA ES was conducted in 2013-15. BEEPS V was conducted in 2013-14 (2011-12 in Russia).
Although the governments in SEMED countries have generally managed to increase the numbers of children enrolled in primary and secondary schools, the quality of this education lags behind that of the rest of the EBRD region. While the proportion of the population aged 25 and over that had completed at least secondary education more than doubled since 1990, and the proportion of such population that completed tertiary education improved as well, both still lag behind the rest of the EBRD region.
In SEMED, the share of young population is on average much higher than in the rest of the EBRD region. Youth unemployment rates are also among the highest in the world and the shortfall in the number of jobs is exacerbated by a higher education system that is not meeting the needs of the private sector. There is a skills mismatch in the form of an oversupply of university students majoring in social sciences, education and humanities, and not in the fields that offer most of the jobs in the private sector.
Issues related to electricity were also among the top four business environment obstacles in Egypt and Morocco, and the sixth most severe obstacle in SEMED as a whole. SEMED countries have relied on energy price subsidies as their main tool to provide social protection for decades. However, while they provide some support to the poor, they also come with (unintended) consequences: they weigh on government budgets at the expense of much-needed investment in infrastructure, education and healthcare; encourage capital-intensive industries to the detriment of employment-intensive activities; and foster overconsumption and damage to the environment.
All of the countries in the SEMED region have increased their electricity prices in the last few years, and aim to eliminate price subsidies in the future. In addition to the otherwise-needed electricity price increases, companies in most SEMED countries also had to deal with unreliable electricity supply, long waiting times and corruption in relation to applications for electricity connections.
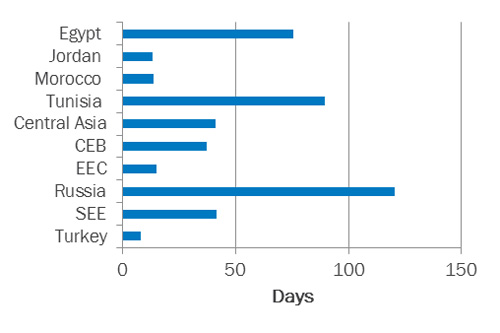
It took on average almost 48 days to be connected to electricity in SEMED countries, compared with 36.3 days in the rest of the EBRD region. The percentage of firms reporting that informal gifts and payments had been expected or requested in return for being connected was above the rest of the EBRD region average as well – 20 per cent, compared with 12.1 per cent.
That being said, there exists huge variation across the SEMED countries. In Jordan and Morocco, firms were connected to the electricity grid within less than two weeks, while they had to wait more than 75 days in Egypt and almost 90 days in Tunisia (Chart 11) – the situation was worse only in Russia, where the firms had to wait 120 days. In both Egypt and Tunisia, the investment in the networks has been lagging behind due to lack of funding.
Chart 11. Waiting time to be connected to electricity
Source: MENA ES, BEEPS V and author’s calculations.
Note: MENA ES was conducted in 2013-15. BEEPS V was conducted in 2013-14 (2011-12 in Russia).
In Jordan, no firms reported that informal gifts or payments had been expected or requested in return for being connected, while in Egypt, more than 40 per cent did. This was again higher than in any other EBRD region and second only to the Kyrgyz Republic, where half of all firms reported that informal gifts or payments had been expected or requested in return for being connected.
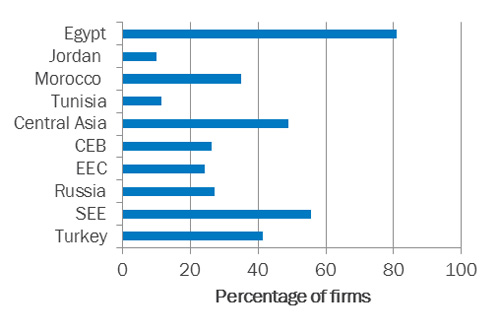
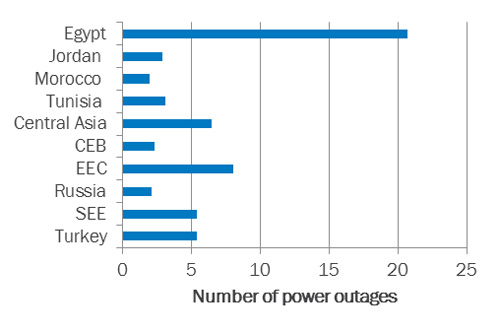
Although slightly fewer firms reported experiencing power outages in SEMED than in the rest of the EBRD region, they on average experienced more power outages in a typical month (7.2, compared with 5.2 in the rest of the EBRD region). Firms in Egypt had to deal with more than their fair share of power outages, with more than 80 per cent of them experiencing outages (among the highest in the EBRD region), compared with 35 per cent of firms in Morocco and 10-12 per cent in Jordan and Tunisia (Chart 12). Jordan had an energy crisis in 2012, but has since recovered.
Chart 12. Experienced power outages
Source: MENA ES, BEEPS V and author’s calculations.
Note: MENA ES was conducted in 2013-15. BEEPS V was conducted in 2013-14 (2011-12 in Russia).
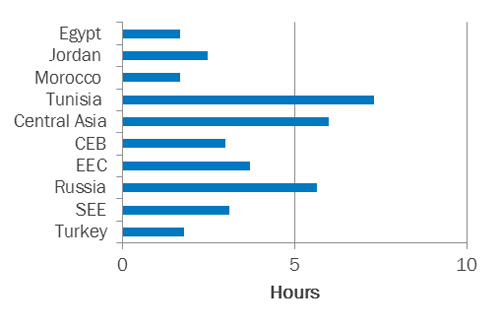
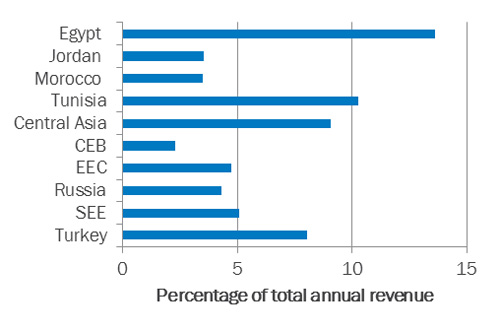
Egypt also performed much worse than others in terms of the number of power outages in a typical month (Chart 13) – the situation was particularly bad in 2014, when most of the interviews in Egypt took place. While each of the power outages was on average shorter in duration than in other SEMED countries and EBRD regions (Chart 14), they resulted in higher losses – 13.6 per cent of total annual revenue, again among the highest in the EBRD countries. Losses resulting from power outages were also higher than in other EBRD regions in Tunisia – 10.3 per cent of total annual revenue (Chart 15).
Chart 13. Number of power outages in a typical month
Source: MENA ES, BEEPS V and author’s calculations.
Note: MENA ES was conducted in 2013-15. BEEPS V was conducted in 2013-14 (2011-12 in Russia).
Chart 14. Duration of power outages
Source: MENA ES, BEEPS V and author’s calculations.
Note: MENA ES was conducted in 2013-15. BEEPS V was conducted in 2013-14 (2011-12 in Russia).
Chart 15. Losses due to power outages
Source: MENA ES, BEEPS V and author’s calculations.
Note: MENA ES was conducted in 2013-15. BEEPS V was conducted in 2013-14 (2011-12 in Russia).
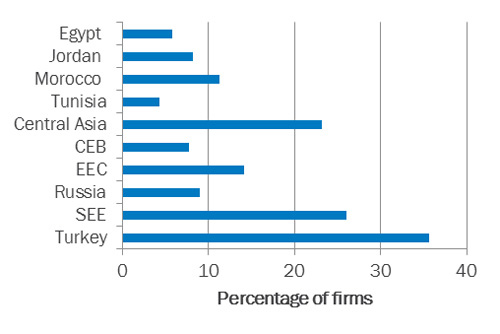
It is interesting to note that firms in SEMED countries were much less likely than firms in the rest of the EBRD region to deal with unreliable electricity supply by owning or sharing an electricity generator. Only 7.4 per cent of firms in SEMED took matters into their own hands, compared with 17.8 per cent of firms elsewhere (Chart 16). The difference is driven mostly by the lower share of SMEs that own or share an electricity generator: in SEMED, only 6.1 per cent did so, while in the rest of the EBRD region the percentage stood at 16.9 per cent. In Jordan, 62.4 per cent of large firms owned or shared an electricity generator, compared with 5.8 per cent of SMEs. While many large firms in the tourism sector in particular may have a generator, the investment might not be affordable to firms in other sectors and SMEs as the cost of electricity generated in this way would likely be higher than the subsidised price of electricity from the public grid.
Chart 16. Firms that own or share an electricity generator
Source: MENA ES, BEEPS V and author’s calculations.
Note: MENA ES was conducted in 2013-15. BEEPS V was conducted in 2013-14 (2011-12 in Russia).
Interviews with the managers of more than 4,400 firms reveal that firms in the SEMED region face a difficult business environment. They regard political instability, corruption and competitors’ practices in the informal sector as the main business environment obstacles, but the business environment they are facing on average compares less than favourably to that of the rest of the EBRD region on other dimensions as well – in particular, access to finance, workforce skills and reliability of electricity supply. Moreover, SMEs in particular are more likely to be credit-constrained than their counterparts in the rest of the EBRD region.
(i) MENA ES surveys were also conducted in Djibouti, Israel, Lebanon, West Bank and Gaza and Yemen.
(ii) For example, growing firms may regard workforce skills as more of an obstacle than shrinking firms, even if they are both in the same sector and location. In order to address this difficulty, this analysis uses the perceived severity of constraints to measure the quality of the various components of the business environment and controls for characteristics of individual firms (including size, age, industry and export activity), as well as characteristics of the individual manager who responded to the survey (such as gender, length of service and position within the firm).
(iii) M. Gasiorek, N. Bottini and C. Lai Tong (2014), “Employment dynamics in Morocco: The role of the business environment and asymmetrical policy treatment.” Mimeo, World Bank, Washington, DC.